Display Table of Contents
What ‘pay for themselves’ means: payback period and lifetime savings
When solar panels “pay for themselves”, the system has generated enough financial benefit to match the upfront cost. Most households measure this point using the payback period, which is the number of years it takes for bill savings and any export income to equal the purchase and installation price. Payback is a cash-flow measure, so it focuses on what you spend and what you get back year by year, based on actual tariffs and typical household demand.
Lifetime savings describe a different idea. Instead of stopping at break-even, lifetime savings estimate the total benefit over the system’s working life, minus costs such as maintenance and inverter replacement. This figure depends on how much electricity the home uses during daylight hours, the export rate paid for surplus power, and future electricity prices. In the United Kingdom, export payments often sit under the Smart Export Guarantee (SEG), although rates vary by supplier. Panel output also changes with roof angle, shading, and seasonal weather patterns.
Both measures matter. Payback helps compare solar with other home upgrades, while lifetime savings show the long-term value once the system has reached break-even. Used together, they give a clearer view of short-term affordability and long-term return.
Upfront costs that set the payback clock: panels, inverter, installation, and VAT
The payback clock starts with the total amount paid to buy and fit the system. That figure usually includes the solar panels (modules), an inverter, mounting hardware, electrical protection equipment, labour, and VAT. Since payback compares upfront cost with annual savings and export income, small differences in purchase price can shift the break-even point by years.
Solar panels (modules)
Module cost varies with power rating (measured in kilowatts peak, kWp), efficiency, warranty length, and manufacturer. Higher-efficiency panels can produce more electricity from the same roof area, which can improve payback where space limits system size. Even so, premium modules only shorten payback if the extra generation value exceeds the price uplift. Warranty terms matter because a longer product warranty can reduce the risk of unexpected replacement costs during the payback period.
Inverter and other key hardware
The inverter converts the panels’ direct current (DC) into alternating current (AC) for home use. Most homes use a string inverter, although some installations use microinverters or optimisers. Inverter choice affects both cost and resilience. Many inverters need replacement once during a system’s life, so a realistic budget should allow for that future expense when estimating payback. If you add a battery, costs rise sharply, even though self-consumption often improves.
Installation and scaffolding
Installation charges cover design, roof mounting, wiring, testing, and commissioning. Scaffolding often forms a significant share of the bill, particularly for taller properties or complex access. Roof condition can also affect cost; for example, a fragile roof covering may require extra care or remedial work. Installer quality matters because poor workmanship can reduce output and create repair costs that delay payback.
VAT and eligibility
VAT treatment can change the upfront figure. In Great Britain, a 0% VAT rate can apply to energy-saving materials in residential settings, subject to the rules set by HM Revenue & Customs (HMRC). Confirm how the installer applies VAT on the quotation, especially if the project includes non-qualifying work.
What to check on a quotation
- System size (kWp) and expected annual generation (kWh), with assumptions stated.
- Panel and inverter brands, model numbers, and warranty lengths.
- Scaffolding and any electrical upgrades itemised.
- VAT rate shown clearly and applied to each line item.
- Installer accreditation, such as MCS, which many export tariffs require.
How much electricity a home solar system generates in the United Kingdom
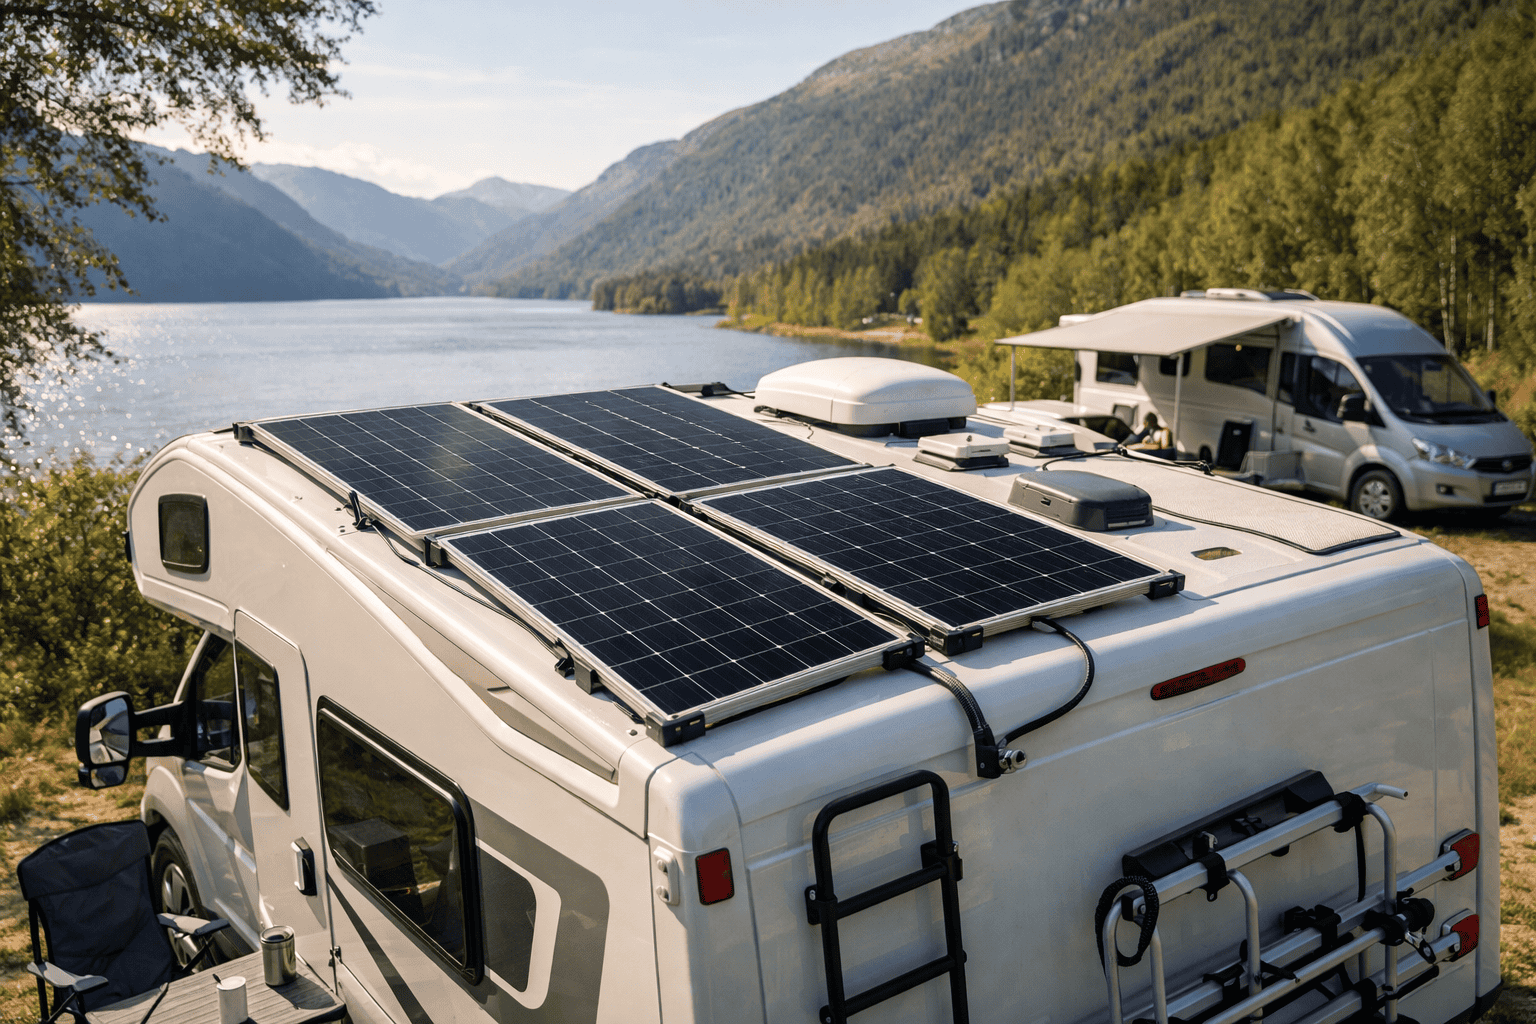
A home solar photovoltaic (PV) system in the United Kingdom generates electricity based on system size (measured in kilowatts peak, kWp), roof orientation, shading, and local weather. As a practical guide, a typical 4 kWp system often produces about 3,000 to 3,800 kWh per year, although real results vary by region and roof conditions. Homes in southern England usually achieve higher output than properties in Scotland, while heavy shading can reduce generation sharply.
Season also matters. Solar PV produces most electricity from late spring to early autumn, with long daylight hours and stronger sunlight. Winter output drops, so annual generation depends on how well summer production offsets lower winter yields. Since payback depends on how much solar electricity a household uses at the time it is generated, daytime demand plays a key role. For example, running appliances during daylight can raise self-consumption (the share used in the home) and increase bill savings.
For a quick sense check, the Department for Energy Security and Net Zero provides official energy guidance, while the PVGIS tool offers location-based generation estimates using historical solar data.
How self-consumption and export payments change the payback period
Self-consumption means using solar electricity in the home at the time the system generates it. Since each kilowatt-hour you use directly can replace a unit bought from the grid at the full retail rate, higher self-consumption usually shortens the payback period. Export works differently. When the home sends surplus electricity to the grid, the supplier pays an export rate, which often sits below the import price. As a result, a system that exports a large share of generation can still pay back, but it often does so more slowly than a system that uses more on site.
Export payments still matter, especially in summer when generation peaks. Most households receive export income through the Smart Export Guarantee (SEG). Ofgem sets the framework and lists licensed SEG suppliers on its official page: Ofgem Smart Export Guarantee (SEG). Rates vary by supplier and tariff type, so export income can shift the payback period by months or years.
Household habits often drive the biggest change. Daytime appliance use, hot water timing, and electric vehicle charging can raise self-consumption. A battery can increase self-consumption further, although the extra cost can extend payback unless the household uses the stored energy regularly.
Household electricity prices and tariffs: why rates drive payback speed
Electricity prices and tariff design often determine payback speed more than small differences in panel efficiency. Each kilowatt-hour (kWh) that solar supplies to the home avoids buying a kWh from the grid at the import unit rate. When import rates rise, the value of each self-used kWh rises with them, so annual bill savings increase and the payback period usually shortens. When import rates fall, the opposite effect applies, and payback can extend even if the system output stays the same.
Tariffs also shape the value of solar across the day. Under a flat-rate tariff, every avoided kWh has the same value, so payback depends mainly on total self-consumption and export income. Under time-of-use tariffs, the unit rate changes by time band. Solar generation tends to peak around midday, while many households use more electricity in the early morning and evening. If peak-priced periods sit outside solar hours, a home may still buy expensive electricity at those times, which can slow payback unless the household shifts demand to daylight hours or uses a battery.
Standing charges matter as well. Solar reduces unit consumption, yet it does not reduce the daily standing charge, so households with high standing charges see a smaller percentage reduction in total bills for the same solar output. That effect becomes more noticeable in low-consumption homes.
Export rates add another layer. Many suppliers offer export payments under the Smart Export Guarantee (SEG), but export prices vary widely and can change over time. Since export typically pays less than import costs, payback improves most when tariffs encourage daytime use at home, while export income provides a secondary benefit. For current policy context and SEG rules, refer to Ofgem.
Roof and site factors that affect performance: orientation, shading, and system size
Roof and site conditions often explain why two similar homes see different payback periods. Since payback depends on annual generation and how much of that electricity the household can use, small performance losses can add years to the break-even point.
Orientation and tilt set the baseline. In the United Kingdom, a south-facing roof at a moderate pitch usually produces the highest annual output. East- or west-facing arrays can still perform well, yet they tend to generate less across the year. That reduction lowers bill savings and export income, which can slow payback. A split east–west layout may suit homes that use more power in the morning and late afternoon, since it spreads generation across the day rather than peaking at midday.
Shading can have a larger impact than orientation. Chimneys, dormers, trees, and nearby buildings may shade part of the array for hours at a time. Even partial shading can cut output, particularly when it affects multiple panels in a string. Installers often reduce this risk through careful panel placement and by using module-level power electronics such as microinverters or optimisers. For example, Enphase microinverters can limit the effect of shading on the rest of the array. A site survey should also check for seasonal changes, since winter sun sits lower and can increase shading.
System size matters, yet bigger does not always mean faster payback. A larger array costs more upfront and may export more electricity at a lower rate than the import price, which can lengthen payback if the home cannot use the extra generation. Matching size to annual consumption, roof space, and likely self-consumption often delivers stronger value than maximising kWp. For generation estimates, the PVGIS calculator provides location-based modelling that helps set realistic expectations.
Maintenance, degradation, and replacements: how they affect long-term returns
Maintenance and component ageing shape the real return from a solar photovoltaic (PV) system. Most systems need little routine work, yet small costs and gradual output loss can shift the break-even point.
Routine maintenance: low cost, but not zero
Solar panels have no moving parts, so owners usually focus on visual checks and safe access. Dirt and leaf build-up can reduce output, especially near trees or in areas with heavy bird activity. Rain often clears light soiling, while professional cleaning may help where grime persists. Any cleaning should follow the installer guidance to avoid damaging seals or frames.
- Typical tasks: occasional cleaning, checking for shading changes, and reviewing monitoring data for unexpected drops.
- Common costs: minor call-outs for loose wiring, damaged isolators, or monitoring faults.
Degradation: gradual output decline
Panels produce slightly less electricity each year as materials age. Many manufacturers quote degradation rates around a fraction of a per cent per year, backed by performance warranties. A modest decline rarely changes the economics on its own, yet it reduces lifetime savings, so payback estimates should not assume flat output for 25 years. For UK performance assumptions and typical yields, consult the Department for Energy Security and Net Zero and the Energy Saving Trust.
Replacements: the inverter often drives mid-life spend
The inverter converts direct current from panels into usable alternating current. Many inverters last around 10 to 15 years, so a replacement can arrive before the panels reach end of life. That one-off cost can extend payback if it falls early, or have little effect if the system has already broken even.
When comparing quotes, ask for inverter warranty length and the expected replacement cost, including labour and any scaffolding.
Battery systems, if fitted, may need earlier replacement than panels. Any plan for long-term returns should include realistic allowances for component lifetimes and warranty cover.
Typical payback ranges in the United Kingdom and how to estimate yours
In the United Kingdom, many households see solar PV pay back in roughly 8 to 15 years. A well-sited system with high self-consumption can reach break-even sooner, while a shaded roof or low daytime use can push payback beyond 15 years. Treat any single figure as a guide, since payback depends on your import unit rate, export rate, and how much solar electricity you use at home.
To estimate your own payback, start with the installed price after any discounts. Next, estimate annual generation from your system size and roof conditions, then split that output into self-used and exported electricity. Value self-used units at your electricity import price, and value exported units at your export tariff under the Smart Export Guarantee (SEG). Ofgem explains how SEG works and which suppliers offer tariffs on its official pages: Ofgem: Smart Export Guarantee.
Annual benefit equals bill savings plus export income, minus expected maintenance and any planned inverter replacement. Divide the upfront cost by that annual benefit to get an estimated payback period in years. Recheck the calculation if your tariff changes or you add a battery or electric vehicle, since both can shift self-consumption.
FAQ
Do solar panels always pay for themselves?
Many systems do, yet payback is not guaranteed. Payback depends on site performance, household use patterns, electricity prices, and export rates. A shaded roof, low daytime use, or low import prices can extend the break-even point.
Does a battery make payback faster?
A battery can increase self-consumption, which often improves annual savings. Even so, the battery adds upfront cost and may need replacement during the system life. For some homes, a battery improves resilience and bill control more than payback speed.
What happens if I move house before payback?
You may not recover the full cost through bills alone before you sell. Even so, solar can still add value by lowering running costs and improving the home’s energy performance. Ask the installer for clear documentation, including warranties and system details, to support a sale.
Do solar panels work in winter and on cloudy days?
Yes. Solar photovoltaic (PV) panels generate electricity from daylight, not heat. Output falls in winter because days are shorter and the sun sits lower, so payback relies on annual generation rather than summer peaks.
Will cleaning or maintenance change the payback period?
Minor soiling rarely transforms payback, although heavy dirt, bird droppings, or leaf build-up can reduce output. A safe visual check and occasional professional clean, when needed, helps protect performance without adding unnecessary cost.
Are payback claims regulated in the United Kingdom?
Marketing must remain accurate and not misleading. For consumer protection guidance, see the Citizens Advice consumer pages. For installer standards and certification, check MCS (Microgeneration Certification Scheme).
Which figures should I request in a quote?
Ask for a written estimate that states:
- System size (kWp) and expected annual generation (kWh)
- Assumed self-consumption percentage and export rate
- Assumed import unit rate and tariff type
- Itemised costs, including inverter and any scaffolding
- Warranties for panels, inverter, and workmanship